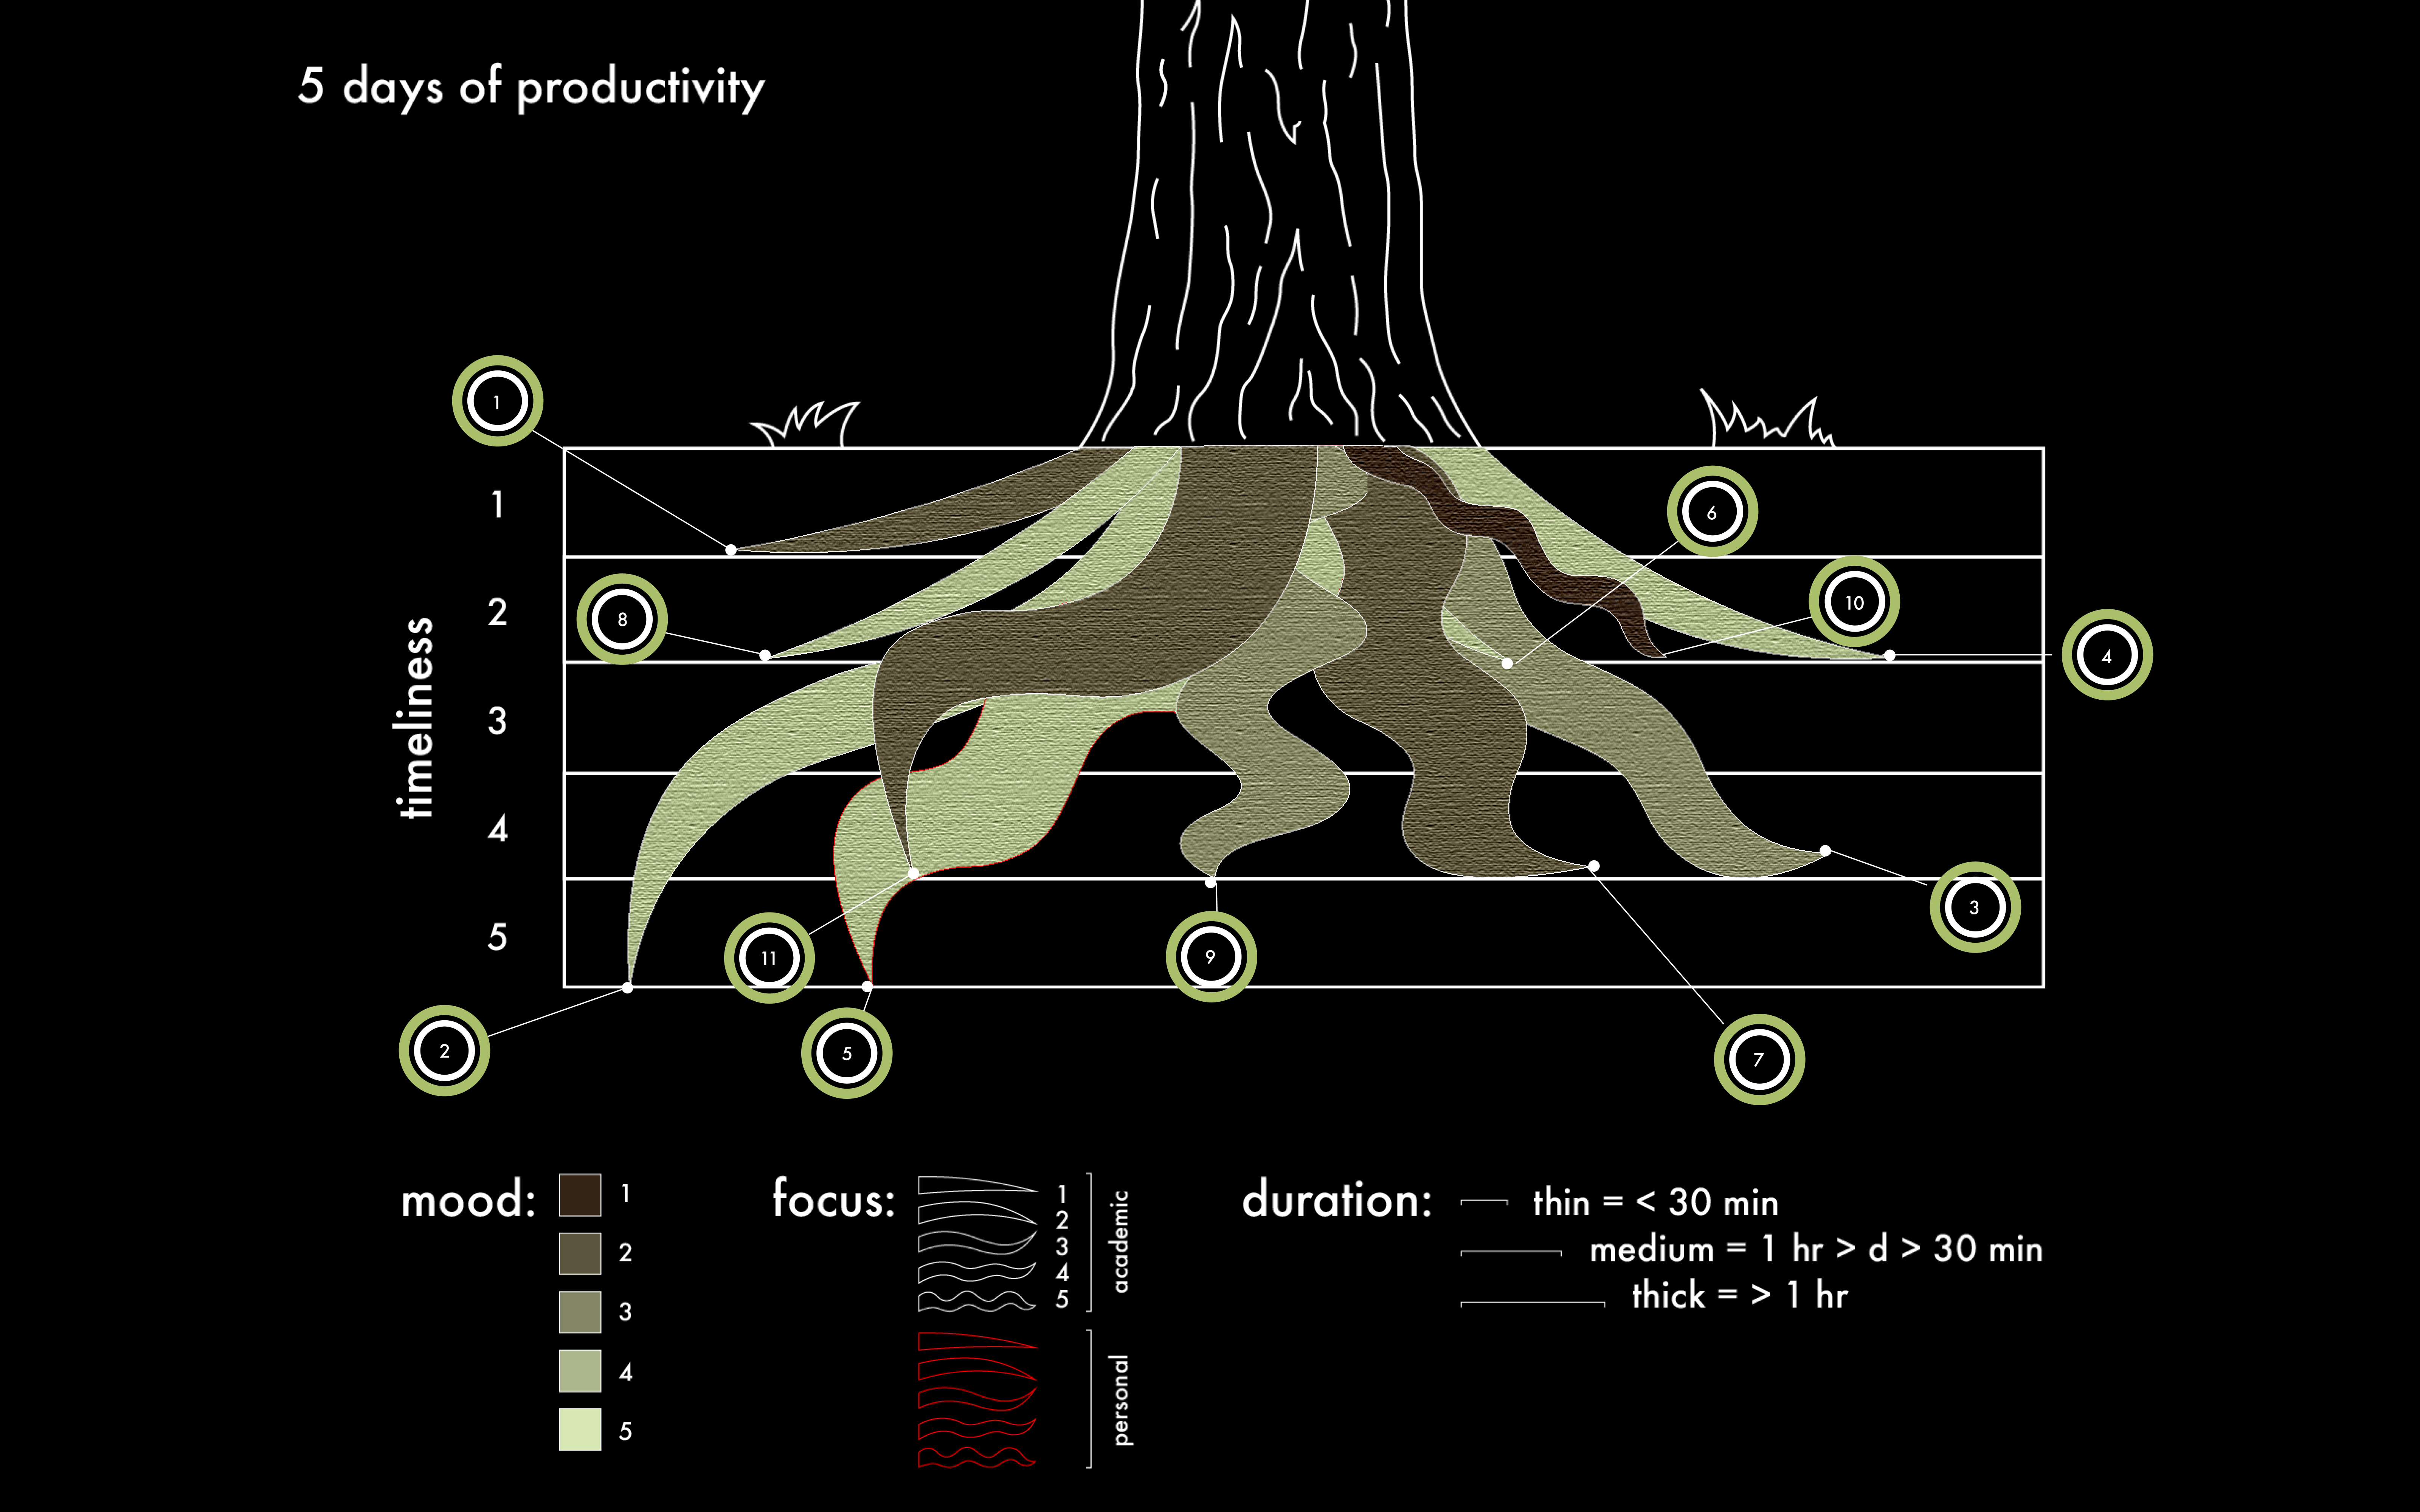
Visualizing Productivity — a five-day diary, drawn as roots.
Data visualization of my recorded productivity levels over the course of five days.
Read about the full process on Notion ↗.
Thank you for reading!
For work inquiries, feel free to contact me at kwakerica@gmail.com.
Next
The Eggery →